 Lee, S., & Wolpoff, M. (2003). The pattern of evolution in Pleistocene human brain size Paleobiology, 29 (2), 186-196 DOI: 10.1666/0094-8373(2003)0292.0.CO;2
There has been a bit of debate around the biology blogoverse recently about the evolution of human brain size. It started off as an “idle speculation” type argument, but then took a satisfying swerve into the evidencey regions of science, which is always satisfying. The upshot of this is that I’ve spent today riffing statistically on some fossil data from a relatively old paper on the evolution of human brain size, and seeing if I can tease some interesting tidbits out of it.
Some background
It all kicked off when neuroscientist Colin Blakemore made some comments on the evolution of the human brain. He argued that the large increase in brain size we see around 200k years ago may have been a useless “macromutation” that was tolerated due to the abundance of food. The evolutionary implausibility of this was evaluated unfavourably by and Jerry Coyne.
I’ve heard lots of plausible reasons that human brain size may have seen an increase 200k years ago or so; my personal favourite is that it was due to the discovery of fire, which made food easier to eat, giving more calories and allowing children to be born without the fully connected skull required to attach the jaw muscles for chewing tough food. This would loosen up constraints on selection for brain size, allowing brain size to rush ahead.
Either way, none of the hypotheses proposed have had much strong evidence put forward for them yet (maybe when we bring some Evo-Devo to the party?), and this is particularly true of Blakemore’s theory.
More interesting, and more answerable, is the question of whether there was a sudden increase in brain size at all, and if so when exactly it happened. John Hawkes put up a graph of data from a review of human brain evolution by Lee and Wolpoff, and used it to argue that brain size has been increasing gradually for millions of years, with no recent “jump”. In response, Ciarán Brewster did some basic number crunching to establish that, even if there wasn’t a sudden macromutation 200 kya, the human brain seems to have been increasing in size faster over the last 200 kya, compared to before that.
If and when did brain growth speed up?
I decided to delve a little bit deeper into the data from the paper. The problem with Ciarán’s analysis is that it assumes that if there was a speed-up, it started 200k years ago. This is a slightly problematic assumption, mostly because of the winner’s curse (oh go look it up).
To do a more rigorous test for the existence of a speed-up, and to estimate when the speed-up happened if there was one, I fitted a least-squared break-point model (a model where the slope of a trend line changes on either side of some point). I compared this to to the basic linear trend-line, to see if it explains the data significantly better.
Here is what I get (the points are the fossils, the dashed line is a linear fit, and the coloured lines are the break-point model):

The model shows a definite speed-up of brain size increase recently, and fits the data significantly better than a simple trend line (F(1,90) = 15.8, p < 10^-5). I estimate that the speed-up occured 252kya, and can say with 95% confidence that it lies between 203 and 377 kya. This result is pretty robust to exactly what model we use; I also tried using a model where brain size grew exponentially with time, and this gave a similar break-point: 250kya, with a 95% interval of 167-402 kya (see this graph).
If you prefer non-parametric statistics, here is a loess smoothing of the data, showing a clear kink around 280kya:

Simon Blakemore’s theory of a single, sudden macromutation is, of course, inconsistent with the data; given that each sample is an individual human, if large brain size was a macromutation we’d see each sample either having a massive brain, or a small one. But, there does appear to be a change in the processes driving brain evolution somewhere between 200 and 400 kya.
Appendix 1: Adding sex into the mix
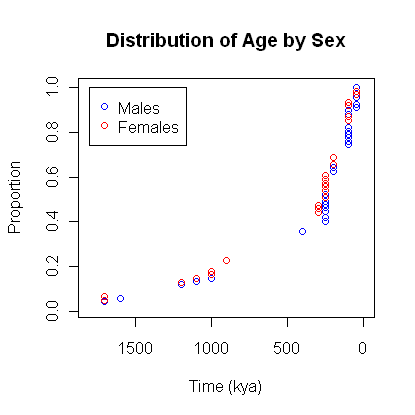
Examining the literature (and by “examining the literature” I mean “googling the sample names”), of the 94 samples in the dataset, 30 are probably male, 24 are probably female, and 40 have not been sexed, or I couldn’t find out the sex (my analysis was pretty haphazard, so don’t take this as gospel). Both sexes have the same age distribution (see here), so it is unlikely that sex would confound the break-point. However, just to be on the safe side, here is the analysis using just males:

And just females:

Both show a similar break-point. The break-point model explains the data significantly better than the linear fit for males (F(1,26) = 20.4, p < 10^-3) but not for females (F(1,20) = 2.9, p = 0.105). Maybe some hint that the change in brain growth was greater for men than for women, perhaps? [Insert fruitless and subconciously sexist speculation here]. We don't have much data, and you'd want to get an expert to classify the sexes before you drew any conclusions.
Appendix 2: Lee and Wolpoff’s Slightly Weird Model
In the original paper, Lee and Wolpoff argue that there is in fact no discontinuity anywhere, essentially because if you plot the log of brain size against the log of time, you get a straight line all the way back (Figure 3 in the paper). A log-log relationship corresponds to fitting an exponent model of Y = Axb (where y is brain size and x is number of years before present), which looks like this:

And indeed, under this model, you cannot find any break points that will significantly improve the fit. The model is pretty weird though; in our case, the model basically corresponds to brain size being inversely proportional to the fifth root of time (b = -0.2). Linear growth makes sense, and exponential growth corresponds to a growth in brain size is proportional to the current brain size, but what does inverse-quintic root growth correspond to? Maybe there is something fundamental going on here, but I expect the goodness of the fit in the graph above is just down to the flexibility of the exponent model, and I’d consider any conclusions drawn from a log-log transformation of the data to be somewhat dodgy (or at least, very underpowered, as the flexibility of the model will tend to obscure true discontinuities).
The authors strange choice of model appears to stem from a slight misunderstanding:
A logarithmic transformation may help avoid the problem of interdependence within the data set because it can be derived from the assumption that the rate of change of cranial capacity at any particular time is proportional to the cranial capacity of the sample at that time
But of course this is an exponential model, which corresponds to a log-linear transformation (the analysis I did above, which still showed a breakpoint); they performed a log-log, which corresponds to a exponent model.
The data I used, including sex classification, is all here. I’d normally put the code I’d used here as well, but in this case it is in a pretty nasty state. If anyone wants it, I can clean it up.

